Data Butler
The following section describes all web based features, services and functionalities, that are part of Data Butler Transparency and Data Butler Quality contracts. Read more about the different packages on our Fleet Data website (https://hoppe-fleetdata.com).
Ship Management
After successful login you will be presented with the fleet overview page:
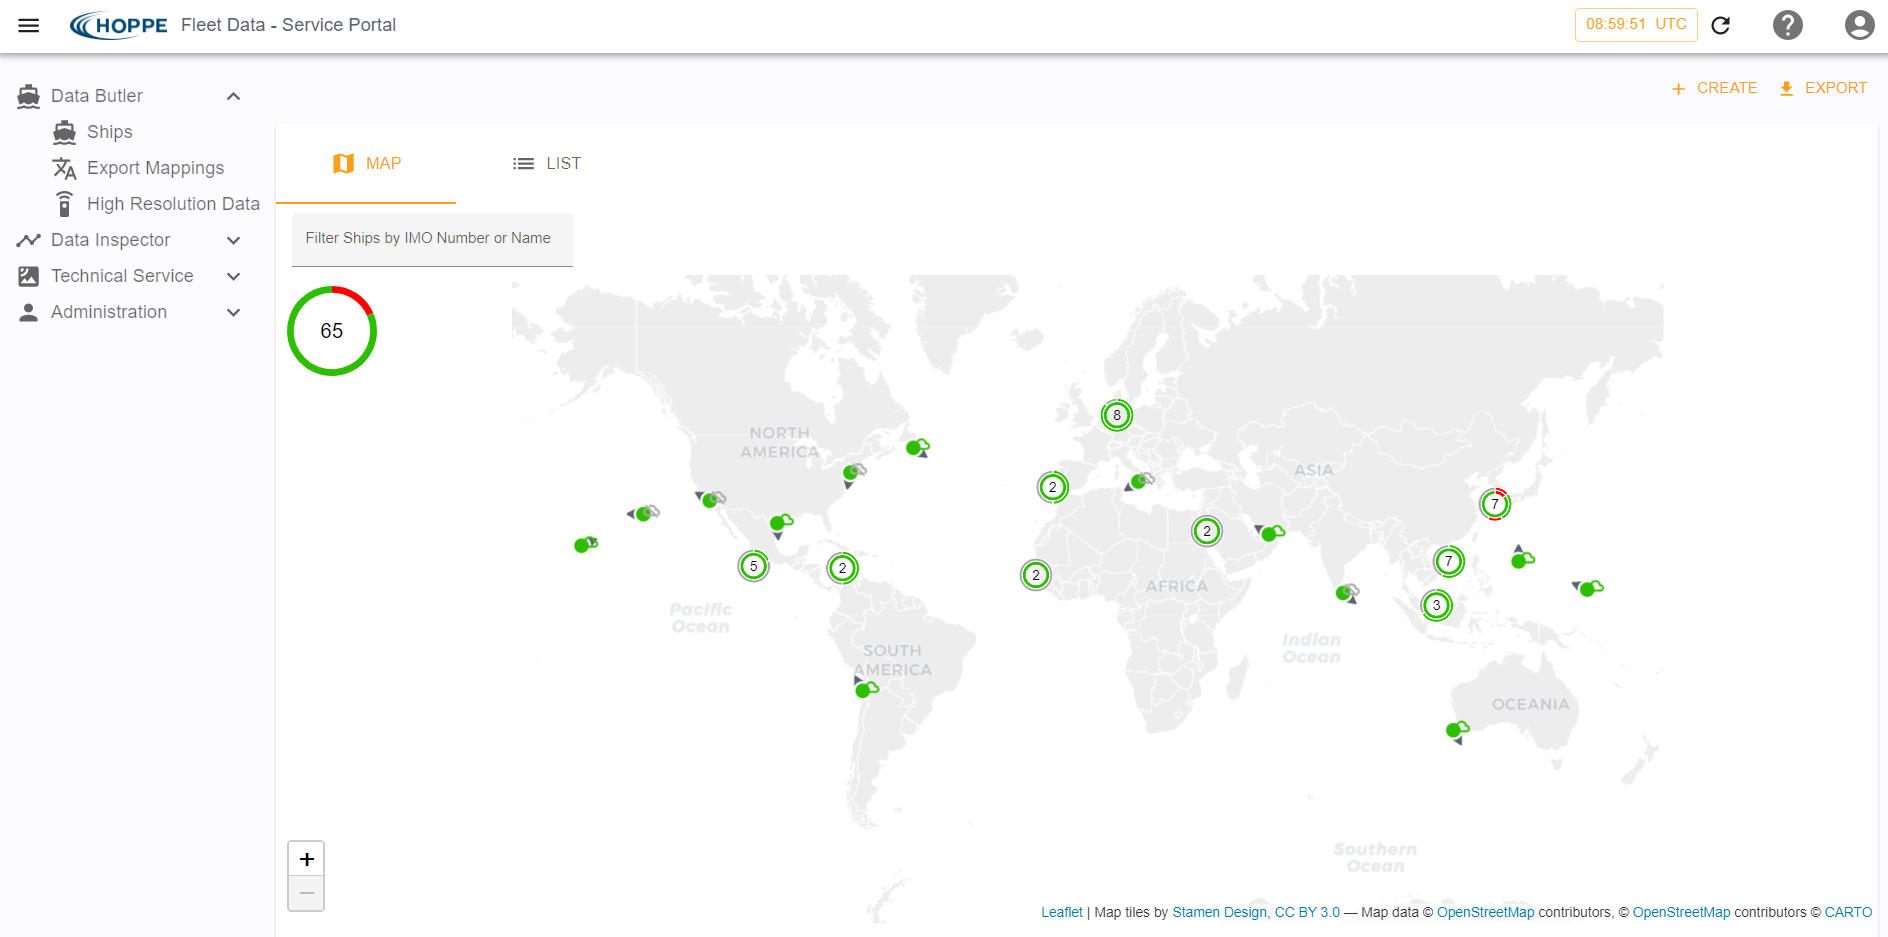
The page displays a variety of information in a graphical representation. All individual green and red dots show ships of which we obtain data regulary.
In addition to the ship status indicators, the portal also provides a ship counter indicator at the top left corner of the map. This indicator shows a number at the center indicating total number of ships (e.g. 41 according to screen shot below) which are expected to transmit data to shore either via STS or via other means.

To find individual ships, just type their name or IMO number in the "Filter Ships by IMO Number or Name" field. Above this field, there is also the possibility to change views from the map visualization to a list by clicking in the "List" tab:
Here you can find an overview over the whole fleet without any effort, including information about connectivity status, IMO number, last connection and more:
Clicking on the ship will lead you to a pop-up drawer, that is described later on and provides a deep-dive into the ship's details. Right clicking on a ship will lead you directly to the Details view, which is described later on.
Ship Status
The status indicator of each ship has three components, a dot, an arrow indicating the heading/course of the ship as well as a small cloud symbol. The following table provides a key for how to interpret the different states of the ship. While the color of the dot tells us the data status (data available or not), the cloud symbol indicates the connectivity status. The arrow around the dot on the map represents the direction in which the ship is headed.
| Symbol | Meaning |
|---|---|
| The latest data for this ship has been uploaded within the last 24 hours, so the ship is considered to be online (green dot). The ship does not have an STS installation (indicated by the gray crossed-out cloud), so we get the data of this ship via other means and have no direct access to our HOMIP device on board. | |
| The latest data for this ship is more than 24 hours old, so the ship is considered to be offline (red dot). The ship has an STS installation but is not providing a heartbeat signal, which is indicated by the red cloud. | |
| The latest data for this ship has been uploaded within the last 24 hours, so the ship is considered to be online (green dot). The ship has an STS installation and is providing a heartbeat signal, which is indicated by the green cloud. | |
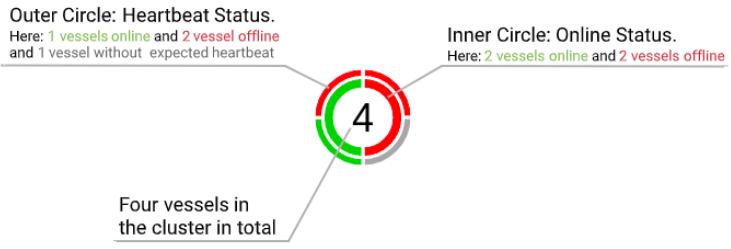 | There are four ships in this cluster. The inner circle indicates the online status of the vessels: in this case, two vessels are online (green inner arc) and two vessels are offline (red inner arc). The outer circle indicates the heartbeat status of the vessels. One of the two vessels which are online (green inner arc) has not been providing its heartbeat signal in time (red outer arc) while the other one is (green outer arc). Of the two vessels which are offline (red inner arc), one has not been providing its heartbeat signal in time (red outer arc) while the other does not have an STS installation so we do not expect a heartbeat signal (gray outer arc). |
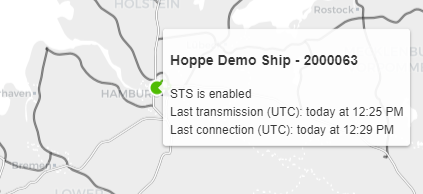
When hovering over individual ships, you can obtain further information, like the ship's name and the last time the ship connected (in case it has STS enabled). An example for this can be seen in the following screenshot:
If you would like to drill down into the data status of the vessel, a single click is will open the vessels connectivity information. A click on a vessel symbol in the map or in the list view will open up the vessel information card as a drawer on the right-hand side with additional information about the ship. The different regions of the vessel information card are explained in more detail below.
Ship Information
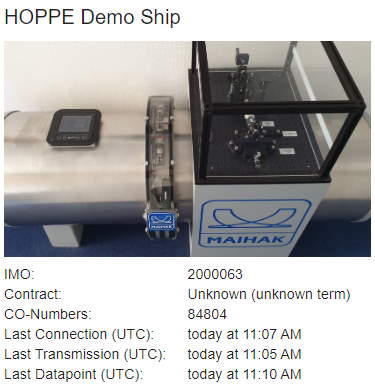
The upper part of the drawer provides a general overview of the ship. The ship's name, its IMO number, data connectivity status and a picture of the vessel (if available) will be displayed.
STS Device Information
If the ship has a HOMIP device on board with a correctly configured STS (Ship to Shore) installation, this section will display information about the device itself, as well as the installed software packages.
Nautical Information
Nautical information for the selected ship is displayed in this section, which includes details about the nearby port if that information is available.
Ship Metadata
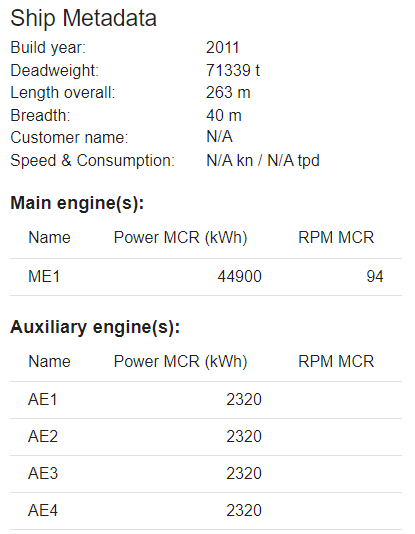
This section of the drawer displays known metadata of a specific vessel. Included are the ship dimensions and engine information.
Ship Details
At the top right corner of the drawer we have the "Details" button, which when clicked will open up the ship's details page with many functionalities.
The other way to access the Details view is by right-clicking on the vessel directly on the world map.
HOMIP Health
General Information
This part displays some of the already provided information from the drawer. You can find information about the ship itself, as well as all existing notifications of the HOMIP (embedded iPC on board).
Event Notification List
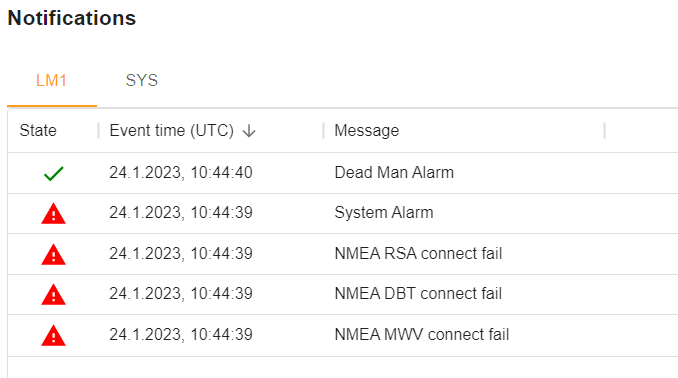
If STS version 1.2.1 or later is installed on the HOMIP device, all events displayed on the device itself are transmitted to the shore. These information will be displayed in the following "Notifications" list. Please note that the datasolutions team might consult in terms of updates and upgrades.
The list always displays the latest state of a notification. In case if the notification was in the alarm state but has since been acknowledged, only the acknowledged status will be shown. Furthermore, the notification list is by default sorted in descending order of event time. The user has the ability to sort any of column in descending or ascending order by clicking on the column header.
User can also filter content of each column by first hovering over the a column header and then clicking on the three dots that appears which opens up a menu (as shown below).
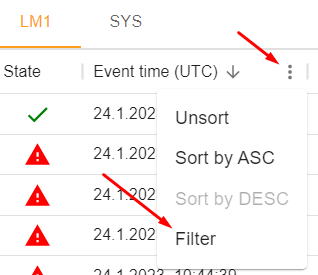
Clicking on the "Filter" option opens up a dialogue box (shown below) from where a user can select the column on which the filter should be applied and the next two options i.e. "Operators" and "Value" would then be adjusted based on the content shown in the selected column.

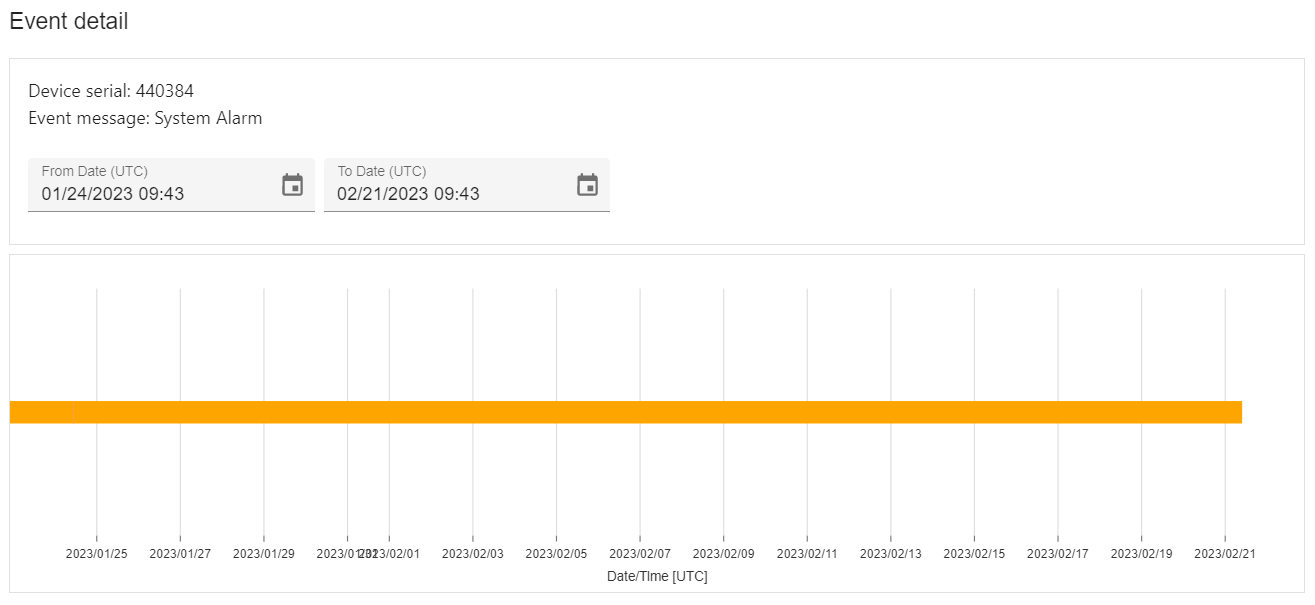
Furthermore, upon a clicking a single event from the notification list above, a pop-up will open providing a detailed history of the selected event's status over a period of four weeks. The time period can be adjusted via the date time fields provided in the upper part of the pop-up. By this the user has the chance to detect specific event patterns.
Syslog and Tracking Files
Besides the mentioned content, if there are system log files or tracking files available, up to the latest two of them are shown here. The files can be issued by the Hoppe Service technician via remote commands from the vessel directly. Often times, these information can provide valuable information for troubleshooting and debugging.
caution
System log files and tracking files contain a lot of specific, technical information and are not intended or adjusted for external use. If you are curious anyway, e.g. to crosscheck the parameter setup of your device, reach out to datasolutions@hoppe-marine.com for further support and advise.
Raw Data Access
Transmission Histogram
The data upload status is displayed in a swarm plot as can be seen in the following figure.
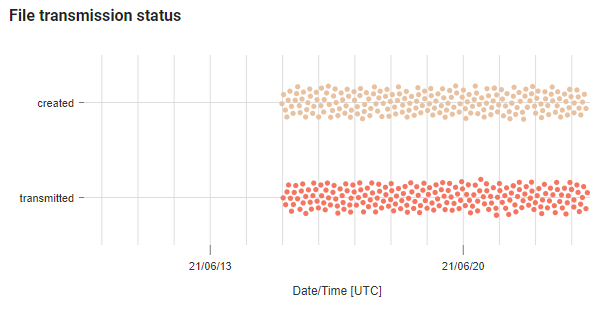
While the chosen representation might seem overwhelming at first, you will quickly gain experience in reading the information quickly. The swarm plot provides an immediate overview as to what is happening on the vessel.
If no STS service is available for the ship and we acquire the data by other means, then no STS data will be displayed. Every available dot represents a data file. The horizontal axis is the time axis. The greater the density of points, the more files were transmitted at that time. Additionally, the file size is encoded in the representation: the larger the dot, the larger the file that it represents.
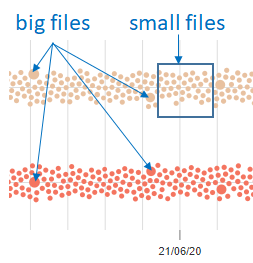
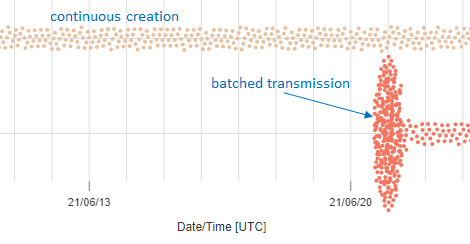
As can be seen, we structured the representation into two rows. The upper row indicates the time at which the file was created while the lower one indicates the time, the file was transmitted to shore. The following example displays how we can use this information. While it can be seen, that the files where continuously created on the ship (data collection on board is working), we had no transmission till 20.06.2021 and then the transmission recovered and all pending files were transmitted in a batch at around 21.06.2021. After this initial rehydration of the storage, the transmission was restored to normal, and for each created file we see a subsequent transmission event.
Additionally, hovering over a dot would give you immediate summary of some of the key properties of the file e.g. file creation date, file transmission date and file size.
CSV Download
There are several use cases, where a certain time-range of a ship specific set of signals and with a certain aggregation data is requested in CSV format. In order to fulfill this requirement we have the "CSV Download" option, which looks like this:
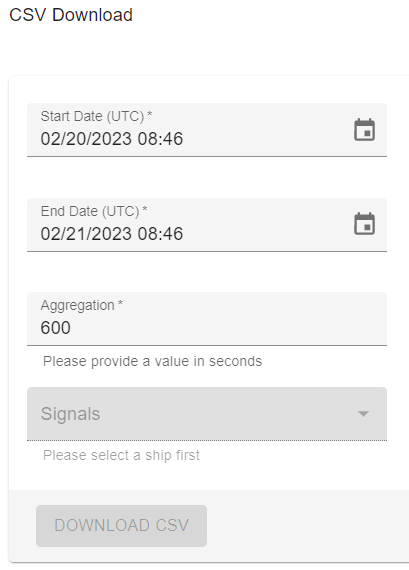
The user can then select multiple signals and provide the desired aggregation and time duration in the respective fields. The user can control the amount of data to be processed in a single attempt:
- User can select up to 200 signals at a time
- The time duration can be up to 14 days
- Configurable aggregation between 600s to 24hrs (86400s)
The "Download CSV" button is enabled as soon as all fields have been filled and have passed the validation checks described above.
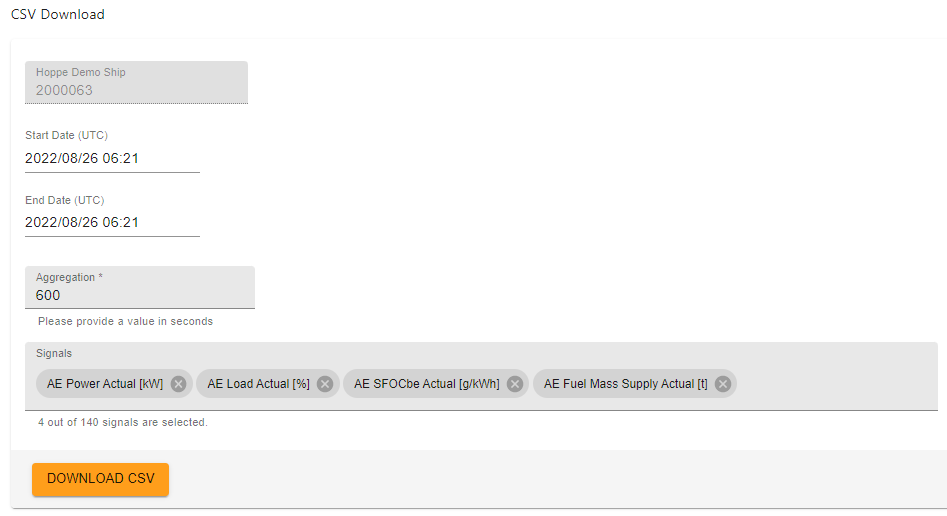
As soon as the user clicks on the "Download CSV" button, the application attempts to fetch the timeseries data for the given parameters and if there is data available then it is downloaded as a CSV file otherwise an error message is shown.
File Data Access
The Fleet Data - Service Portal provides easy access to the data of all managed ships. To access the data head to the "File Data Access" section and proceed as advised by selecting a download format. Clicking the "Download" button will store the file on your local disk in it's source format s3db. This way availability of original database file by iDBS on the ship is ensured. For additional convenience we provide the opportunity to on-the-fly convert s3db files into csv files for easier handling.

Recent Events
Possible STS events which might occur are described in the following list:
| Event Name | Event Description |
|---|---|
| DiskFull | Disk usage above 90 percent. |
| DiskAbove80pc | Disk usage above 80 percent. |
| InboxNotProcessed | Files found in inbox with an age > 1 day. |
| OutboxTruncated | Out box folder size above configured upper level. Oldest files deleted. |
| RejectedFolderTruncated | Rejected folder truncated since it was too big. Oldest files deleted. |
| OutboxFileDelete | File was manually deleted from Outbox by the crew/service technician. |
| OutboxFileDownload | File was manually downloaded from Outbox by the crew/service technician. |
| RejectedFileDelete | Rejected file was deleted manually by the crew/service technician. |
| MonthlyQuotaExceeded | Monthly transfer quota exceeded. |
| VeryLowTransferSpeed | Satellite link too slow. |
| RetryCountExceeded | The file exceeded the retry count and was put to the rejected folder. |
| ResumeCountExceeded | The file exceeded the resume count and was put to the rejected folder. |
| ExponentialBackOffIncreased | Exponential back off was increased. |
| ExponentialBackOffReset | Exponential back off was reset. |
| ShoreLatencyData | Shore latency data. |
| Md5Mismatch | File transferred is not the same on both sides (shore, vessel) and thus fails md5 checksum. |
| StsClientSafeMode | STS Client config replaced by Safe mode file. |
| ConfigUpdateSuccess | Configuration update was success. |
| ConfigUpdateError | Configuration update error. |
| ConfigUpdateFromRest | Configuration update was successful via the HOWEB interface. |
| ConfigSafeModeFromRest | Configuration was replaced by the safe-mode file via the HOWEB interface. |
| FileRejectedTooBig | The file was rejected since it was too big. |
Recent Transmissions
Last not least the tab "Recent Transmissions" displays the last 50 transmissions which took place for the selected device:

It is shown in which direction the transmission took place, when it startet and ended as well as the transferred size of the file. The file name tells you of which kind it was, regular data files are displayed as well as software updates and remote commands going from shore side to the vessel.
Export Mappings
The backbone of the data transformation is the Hoppe developed python based data transformation tool json-data-transformer. This tool provides means to generate arbitrary JSON output formats from a well defined input data format. This tool can be used to transform the output of Hoppes Time Series Data API into almost arbitrary output structures. Additionally versatile math operations can be performed on the output data to condition the data to customers needs (unit conversion, scaling, offset, rounding, and alike).
The following information about the tool is taken from the readme file of the tool:
The module provides means to transform json input data into a new json output data format which can be defined in a simple descriptive language.
Example mapping
Take an data source format, as it is provided via the Hoppe data API:
{
    "imo": {
        "2020-06-16T15:07:16.022Z": "2000063",
        "2020-06-16T15:22:16.011Z": "2000063"
    },
    "me.fts.act.dgc@avg": {
        "2020-06-16T15:07:16.022Z": 37.14391357,
        "2020-06-16T15:22:16.011Z": 37.1570279694
    },
    "timestamp": {
        "2020-06-16T15:07:16.022Z": 1592320036.0222222805,
        "2020-06-16T15:22:16.011Z": 1592320936.011111021
    }
}
Now we have a customer who want's to retrieve the data in e.g. the following format:
[
    {
        "engine": {
            "mainEngines": [
                {
                    "fuelFlows": [
                        {
                            "inletTemp": 37.1439135699802,
                            "type": "HFO"
                        }
                    ]
                }
            ]
        },
        "imoNumber": "2000063",
        "timestampUtc": "2020-06-16T15:07:16.022222"
    },
  ...
]
It becomes clear, that there is a one to one mapping between the two formats. This mapping is given by
{
    "mapping": {
        "ti.utc.act.ts@avg": [{
            "conversionOperation": {
                "arguments": {
                    "x": "ti.utc.act.ts@avg"
                },
                "conversion": "fromtimestamp({x})"
            },
            "targetName": "timestampUtc"
        }],
        "imo": [{
            "targetName": "imoNumber"
        }],
        "me.fts.act.dgc@avg": [{
            "targetName": "engine.mainEngines[0].fuelFlows[0].inletTemp"
        },
        {
            "conversionOperation": {
                "conversion": "HFO"
            },
            "targetName": "engine.mainEngines[0].fuelFlows[0].type"
        }]
    },
    "version": 16,
    "time_format": "iso",
    "structure_delimiter": ".",
    "access_groups": [
        "all"
    ],
    "export_format": "nested_json",
    "name": "company"
}
This module will take in the input data and the mapping information and return the output format.
With this tool in place we can now request customer data in customer specific formats by providing the export_format=FORMAT parameter to the API query, where FORMAT is the name of the mapping and it's version like in this case e.g. company:9 to provide the data in version 9 of the specific mapping.
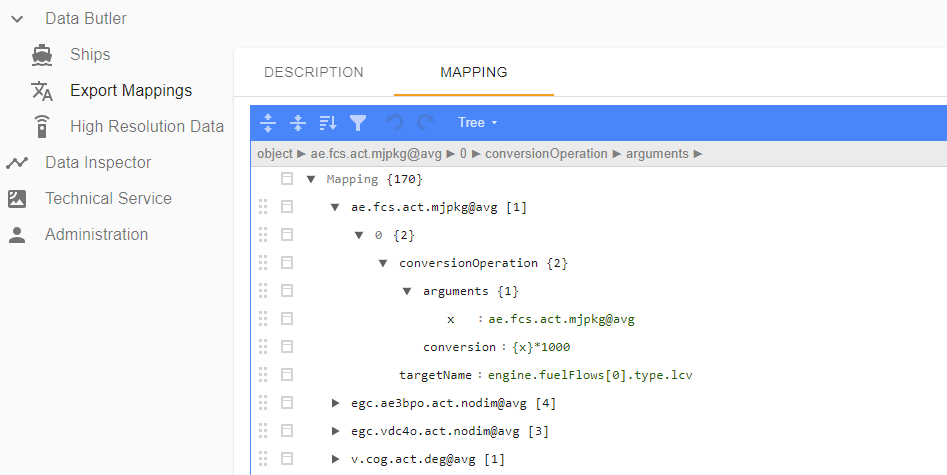
These mappings can be conveniently managed by trained Hoppe employers via the Fleet Data - Service Portal available at https://admin.hoppe-sts.com. A screenshot of the management UI which has been developed in the course of this project as well can be seen below:
caution
In order to create new mappings or update already existing ones, please get in contact with the Data Services Team (datasolutions@hoppe-marine.com).
High Resolution Data
In order to retrieve High Resolution Data from the HOMIP device, it is possible to setup a custom request by clicking on the "Create" button on the top right corner. When selecting a ship and device in the overview, if no request was send before, the screen shows no results yet.
To create a valid request, you have to provide all information shown in the following window:
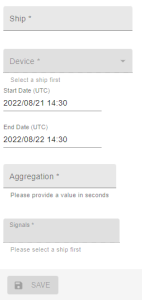
Please select a ship, the HOMIP device on the ship, a valid time range, aggregation rate and choice of signals. To finalize your request, click on the "Save" button and confirm the following pop-up, if you are sure:
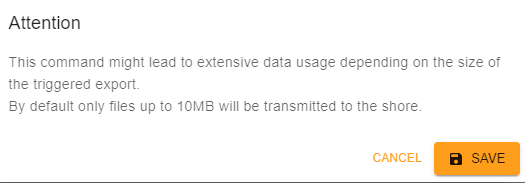
The command will then be send to the ship and executed by the HOMIP device. This could take a couple of minutes. The request will appear in the list and keep you up-to-date about the current state:
While status is "Pending", the command is on its way from shore to ship. As soon as the execution is successful, you see the following changes:

Clicking on the command itself lead you to an overview page, where you can also see the results of your request. The command interface with all query parameters together with some information is displayed and you can excess an s3db file as payload of the custom export:
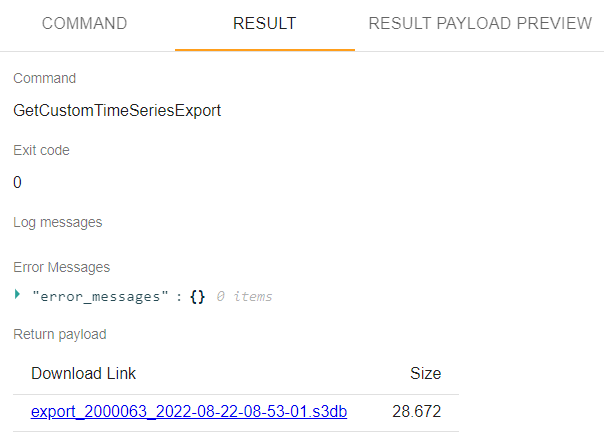
To have a fast look into the payload, there is no download needed. Just click on the "Result Payload Preview" button and a small overview of your request will be displayed. Currently, most files exceed the preview limit, which will lead to the following message:
